Financial Highlights
Download Financial Highlights Data
 Financial Data: 11-year period [Excel 18.8KB]
Financial Highlights
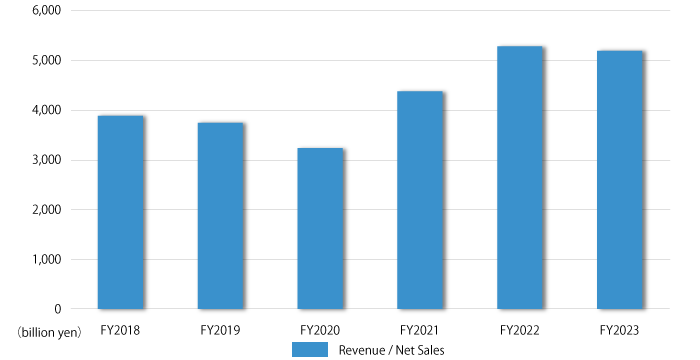
■ Revenue
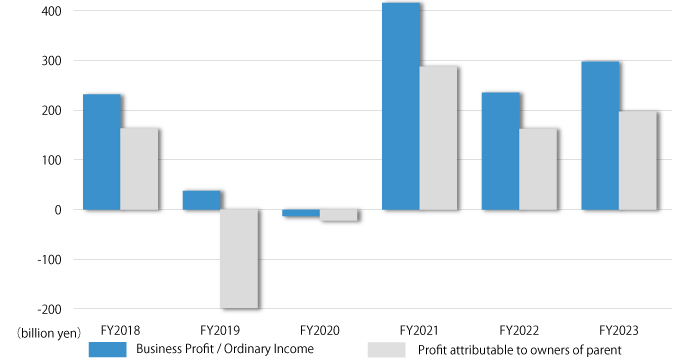
■ Business Profit ・ Profit attributable to owners of parent
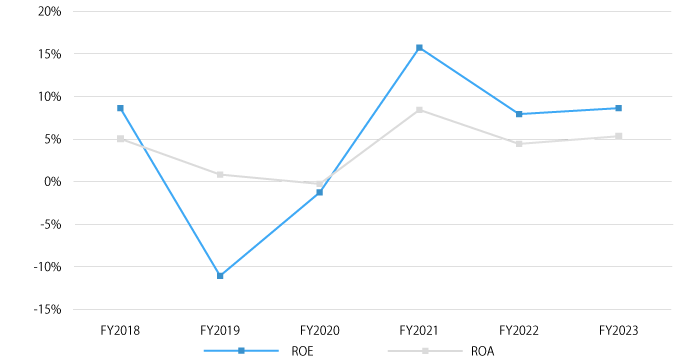
■ ROE ・ ROA
| FY2017 | FY2018 | FY2019 | FY2020 | FY2021 | FY2022 | ||
|---|---|---|---|---|---|---|---|
| Revenue / Net Sales | (billion yen) | 3,678.6 | 3,873.6 | 3,729.7 | 3,227.2 | 4,365.1 | 5,268.7 |
| Business Profit / Ordinary Income | (billion yen) | 216.3 | 232.0 | 37.8 | -12.9 | 416.4 | 235.8 |
| Profit attributable to owners of parent | (billion yen) | 144.6 | 163.5 | -197.7 | -21.8 | 288.0 | 162.6 |
| ROE | (%) | 7.6% | 8.6% | -11.1% | -1.3% | 15.7% | 7.9% |
| ROA | (%) | 5.2% | 5.0% | 0.8% | -0.3% | 8.4% | 4.4% |
※FY2017 : J-GAAP FY2018- : IFRS
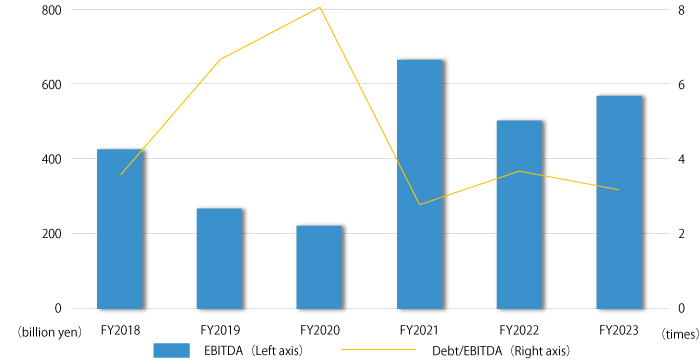
■ EBITDA・Debt/EBITDA
| FY2017 | FY2018 | FY2019 | FY2020 | FY2021 | FY2022 | ||
|---|---|---|---|---|---|---|---|
| EBITDA | (billion yen) | 388.8 | 428.2 | 269.4 | 223.4 | 668.7 | 505.4 |
| Debt/EBITDA | (times) | 3.4 | 3.6 | 6.7 | 8.1 | 2.8 | 3.7 |
※FY2017 : J-GAAP FY2018- : IFRS
■ Capital Investment / Depreciation and Amortization
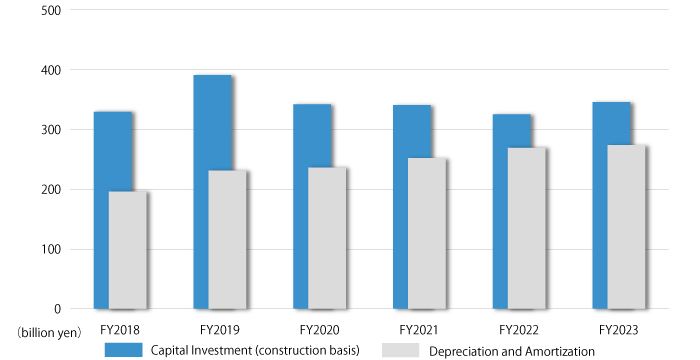
| FY2017 | FY2018 | FY2019 | FY2020 | FY2021 | FY2022 | ||
|---|---|---|---|---|---|---|---|
| Capital investment (construction basis) | (billion yen) | 257.2 | 329.5 | 391.3 | 342.3 | 340.9 | 325.6 |
| Depreciation and Amortization | (billion yen) | 159.5 | 196.2 | 231.5 | 236.3 | 252.2 | 269.6 |
| Research and development expenses | (billion yen) | 34.7 | 37.2 | 38.7 | 36.2 | 39.6 | 43.0 |
※FY2017 : J-GAAP FY2018- : IFRS